
The global debt hangover
October 9, 2016
The legacy of the global financial crash and the Great Recession has left a huge mound of debt globally that weighs down the world capitalist economy. This debt is a major factor, along with the low level of profitability of capital in the major economies and is generating what I call the Long Depression since 2009. Global growth has been well below pre-crisis trends and world trade growth has ground to a halt.
If companies face low profitability on their investment and still have high debts to repay or service, they will be reluctant to invest more. If governments are burdened with high debts as a result of bailing out the banks and because unemployment and social security benefits stay high, then governments cut public investment. If households are still burdened with large mortgages, they won’t spend more, but save. All this adds up to weak investment and low wage and employment growth.
The only saving grace is that central banks have driven global interest rates down towards zero (or even negative), so that servicing debt is cheap and cheap credit can be used by corporations to buy back shares, pay out dividends and speculate in bond and stock markets; for governments to service their bonds and borrow more; and for households to pay their mortgages and run up credit card debt.
But the global debt hangover has not gone away and if interest rates should start to rise or if economies should drop into recession or deflation, this debt burden could turn into a spiral of collapse.
That is what is worrying the international economic agencies like the IMF or the Bank for International Settlements (BIS). The IMF has just reported that global debt is at a record high. Excluding the banking sector, non-financial sector (corporations, households and governments) debt has more than doubled since the turn of the century, reaching $152 trillion last year, and it’s still rising. If you include the banking sector, McKinsey finds that the total debt reaches $200 trillion.

Current debt levels now sit at a record 225% of world GDP, with about two-thirds of that in the private sector (household mortgages and corporate borrowing). The IMF says that slow global growth (the Long Depression in other words) is making it difficult to pay off the obligations,“setting the stage for a vicious feedback loop in which lower growth hampers deleveraging and the debt overhang exacerbates the slowdown.” IMF fiscal chief, Vitor Gaspar, warned that “excessive private debt is a major headwind against the global recovery and a risk to financial stability.”
The IMF laid out the major risks to the financial system. First, European banks are facing a chronic profitability crisis. Many haven’t been able to clear the legacy debt off their balance sheets and investors are increasingly sceptical they’ll be profitable based on their current structures.
This potential banking crisis has been exposed by the debacle of Deutsche Bank, Germany’s largest bank by far in Europe’s most successful economy. Facing massive fines from the American Justice department for ‘mis-selling’ mortgage bonds to clients globally during the great housing boom and bust leading to the global financial crash, Deutsche has been pushed close to the edge and may have to be bailed out by more public money. Last summer, the IMF did a report on German banks and concluded that “Deutsche Bank appears to be the most important net contributor to systemic risks in the global banking system,” followed by HSBC and Credit Suisse. Deutsche has $47trn in notional value of derivatives outstanding. In other words, because it is so big, if it goes down, it will take many other banks with it.
At the same time, Italy’s banks have over €200bn in bad loans on their books from companies which cannot service their debts because of the very weak Italian economy and slow global growth. Italy’s third biggest and oldest bank, Monte Paschi, is bust and has already had two bailouts. And then there are the Portuguese banks, the largest of which,Espirito Santo,like Monte Paschi, had to be bailed out to avoid a systemic crisis.
Second, there is rising corporate debt, particularly in so-called emerging markets. The combined shock of the commodity-price plunge and China’s slowdown has made the surge in private debt a major threat to emerging-market economies.
Investment bank JP Morgan reckons that the debt of non-financial corporations in emerging economies has surged from about 73% of GDP before the financial crisis to 106% of GDP. This 34%-point increase is enormous, averaging nearly 5%-points per year since 2007. In previous research, the IMF has found that an increase in the ratio of credit to GDP of 5%-points or more in a single year signals a heightened risk of an eventual financial crisis. Many emerging market economies have registered such an increase since 2007. Hence the conclusion of the credit analysts, S&P, that “we have reached an inflexion point in the corporate credit cycle”.
The policy answer of the economic authorities in the major economies to the Long Depression has been to tighten government spending and try to reduce deficits on government budgets to get the public debt burden down, while central banks cut interest rates and print money by the trillions to create cheap money to pay debts and invest.
But fiscal ‘austerity’ and cheap money have not worked anywhere to get the world economy going. Zero interest rate policy (ZIRP) has given way to negative interest rate policy (NIRP) and quantitative easing (QE) or printing money to give to the banks is giving way to the idea of ‘helicopter money’ (printing money to give directly to governments or even households). But it is not doing the trick, because this credit just builds up in banks and in speculative financial investment as profitability in productive sectors remains too low to encourage new investment and consequently growth.
Now international agencies like the IMF and the OECD and Keynesian economists are calling for ‘fiscal action’. The big call is for ‘infrastructure investment’, i.e. using government funds to build roads, bridges, communications etc. This would boost investment and employment and get economies going, it is argued. As I have said before, such investment would undoubtedly help but it would have to be huge to have much of an impact. The G20 economies represent 92% of the world economy and in 2014 G20 ministers agreed to raise annual growth by an extra $2trn (without specifying how!). But even if it were done by more infrastructure investment, it would not work. As the chair of JP Morgan, the US investment bank put it: “I would put quantitative targets on things that are under governments’ control, and national GDP growth is not,” Dr Frenkel said. “As much as you’d like to jump 5 metres without a pole you will not be able to.”
Investment by the capitalist sector is seven or eight times larger than government investment in most major economies (China and India excepted). A 1% of GDP increase in government investment sounds large at around say $1trn globally, but it is really a pinprick compared to the annual global investment of close to $20trn.
And anyway, the willingness of governments to initiate such spending is capped by the need to keep control of rising public debt. Public debt is now around 85% of world GDP, according to the IMF data, with no sign of any decline. Only very low interest rates are making it possible to service this debt without even more stringent fiscal ‘austerity’ (government spending cuts and tax rises). A large increase in government investment will drive debt up further, at least to begin with.
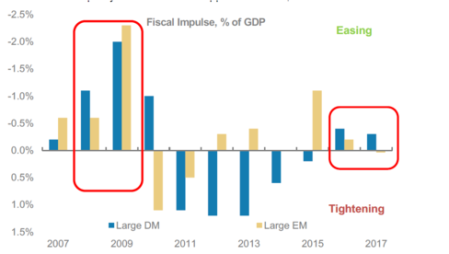
So governments are not doing what the Keynesians (outside and inside the IMF) want. Indeed, the IMF forecasts that budget balances will tighten not relax in both advanced and emerging markets next year. Morgan Stanley, the American investment bank, reckons that the governments of the advanced economies will ease fiscal policy next year but only by 0.3% of GDP — equating to a mild $115 billion increase in spending – nowhere near $1trn or $2trn. “Fiscal easing equivalent to 0.3% of GDP is unlikely to materially increase global growth,” said Elga Bartsch, lead author of the Morgan Stanley report.
The global debt hangover remains and the alka seltzer of cheap and plentiful credit has not cured it. The alternative of fiscal spending won’t work either and won’t be enough anyway. The mainstream economics of monetarism and Keynesianism cannot get rid of this hangover because the world capitalist economy is still drunk from too much debt and starved of profitability.
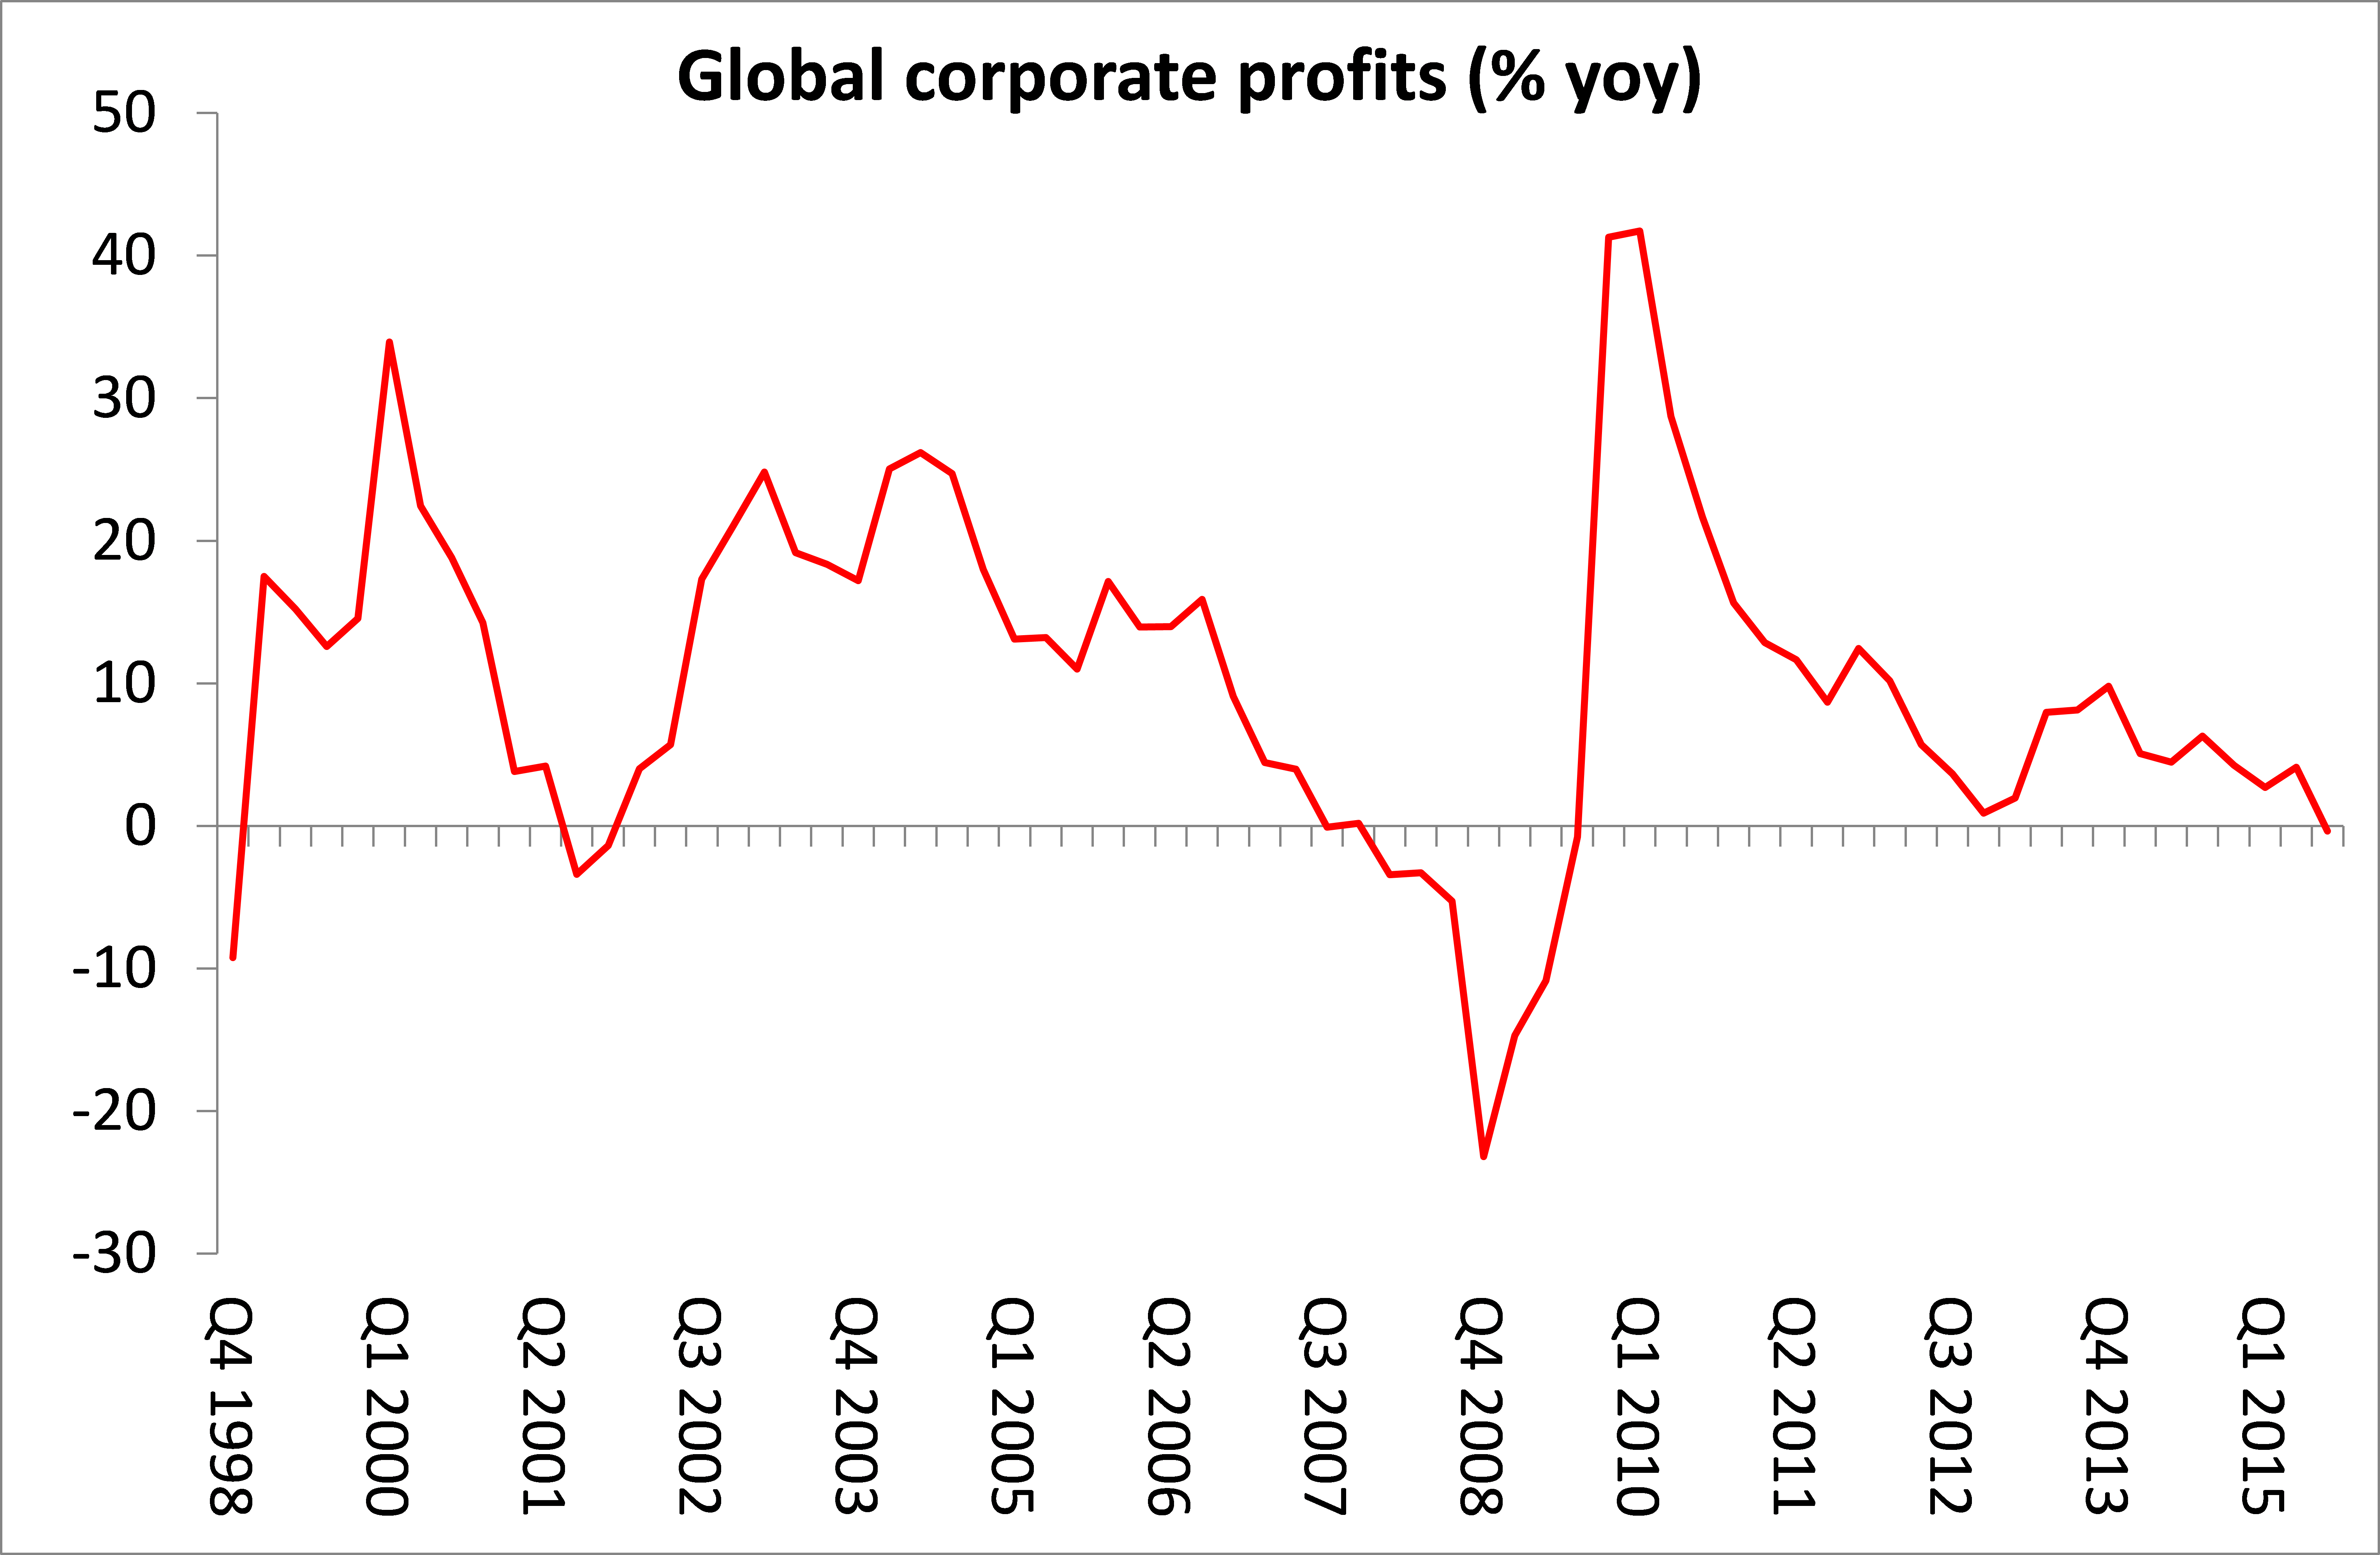
And now total corporate profits are falling globally while debt continues to rise – with the prospect of a new global slump on a fast-approaching horizon.

If companies face low profitability on their investment and still have high debts to repay or service, they will be reluctant to invest more. If governments are burdened with high debts as a result of bailing out the banks and because unemployment and social security benefits stay high, then governments cut public investment. If households are still burdened with large mortgages, they won’t spend more, but save. All this adds up to weak investment and low wage and employment growth.
The only saving grace is that central banks have driven global interest rates down towards zero (or even negative), so that servicing debt is cheap and cheap credit can be used by corporations to buy back shares, pay out dividends and speculate in bond and stock markets; for governments to service their bonds and borrow more; and for households to pay their mortgages and run up credit card debt.
But the global debt hangover has not gone away and if interest rates should start to rise or if economies should drop into recession or deflation, this debt burden could turn into a spiral of collapse.
That is what is worrying the international economic agencies like the IMF or the Bank for International Settlements (BIS). The IMF has just reported that global debt is at a record high. Excluding the banking sector, non-financial sector (corporations, households and governments) debt has more than doubled since the turn of the century, reaching $152 trillion last year, and it’s still rising. If you include the banking sector, McKinsey finds that the total debt reaches $200 trillion.
Current debt levels now sit at a record 225% of world GDP, with about two-thirds of that in the private sector (household mortgages and corporate borrowing). The IMF says that slow global growth (the Long Depression in other words) is making it difficult to pay off the obligations,“setting the stage for a vicious feedback loop in which lower growth hampers deleveraging and the debt overhang exacerbates the slowdown.” IMF fiscal chief, Vitor Gaspar, warned that “excessive private debt is a major headwind against the global recovery and a risk to financial stability.”
The IMF laid out the major risks to the financial system. First, European banks are facing a chronic profitability crisis. Many haven’t been able to clear the legacy debt off their balance sheets and investors are increasingly sceptical they’ll be profitable based on their current structures.
This potential banking crisis has been exposed by the debacle of Deutsche Bank, Germany’s largest bank by far in Europe’s most successful economy. Facing massive fines from the American Justice department for ‘mis-selling’ mortgage bonds to clients globally during the great housing boom and bust leading to the global financial crash, Deutsche has been pushed close to the edge and may have to be bailed out by more public money. Last summer, the IMF did a report on German banks and concluded that “Deutsche Bank appears to be the most important net contributor to systemic risks in the global banking system,” followed by HSBC and Credit Suisse. Deutsche has $47trn in notional value of derivatives outstanding. In other words, because it is so big, if it goes down, it will take many other banks with it.
At the same time, Italy’s banks have over €200bn in bad loans on their books from companies which cannot service their debts because of the very weak Italian economy and slow global growth. Italy’s third biggest and oldest bank, Monte Paschi, is bust and has already had two bailouts. And then there are the Portuguese banks, the largest of which,Espirito Santo,like Monte Paschi, had to be bailed out to avoid a systemic crisis.
Second, there is rising corporate debt, particularly in so-called emerging markets. The combined shock of the commodity-price plunge and China’s slowdown has made the surge in private debt a major threat to emerging-market economies.
Investment bank JP Morgan reckons that the debt of non-financial corporations in emerging economies has surged from about 73% of GDP before the financial crisis to 106% of GDP. This 34%-point increase is enormous, averaging nearly 5%-points per year since 2007. In previous research, the IMF has found that an increase in the ratio of credit to GDP of 5%-points or more in a single year signals a heightened risk of an eventual financial crisis. Many emerging market economies have registered such an increase since 2007. Hence the conclusion of the credit analysts, S&P, that “we have reached an inflexion point in the corporate credit cycle”.
The policy answer of the economic authorities in the major economies to the Long Depression has been to tighten government spending and try to reduce deficits on government budgets to get the public debt burden down, while central banks cut interest rates and print money by the trillions to create cheap money to pay debts and invest.
But fiscal ‘austerity’ and cheap money have not worked anywhere to get the world economy going. Zero interest rate policy (ZIRP) has given way to negative interest rate policy (NIRP) and quantitative easing (QE) or printing money to give to the banks is giving way to the idea of ‘helicopter money’ (printing money to give directly to governments or even households). But it is not doing the trick, because this credit just builds up in banks and in speculative financial investment as profitability in productive sectors remains too low to encourage new investment and consequently growth.
Now international agencies like the IMF and the OECD and Keynesian economists are calling for ‘fiscal action’. The big call is for ‘infrastructure investment’, i.e. using government funds to build roads, bridges, communications etc. This would boost investment and employment and get economies going, it is argued. As I have said before, such investment would undoubtedly help but it would have to be huge to have much of an impact. The G20 economies represent 92% of the world economy and in 2014 G20 ministers agreed to raise annual growth by an extra $2trn (without specifying how!). But even if it were done by more infrastructure investment, it would not work. As the chair of JP Morgan, the US investment bank put it: “I would put quantitative targets on things that are under governments’ control, and national GDP growth is not,” Dr Frenkel said. “As much as you’d like to jump 5 metres without a pole you will not be able to.”
Investment by the capitalist sector is seven or eight times larger than government investment in most major economies (China and India excepted). A 1% of GDP increase in government investment sounds large at around say $1trn globally, but it is really a pinprick compared to the annual global investment of close to $20trn.
And anyway, the willingness of governments to initiate such spending is capped by the need to keep control of rising public debt. Public debt is now around 85% of world GDP, according to the IMF data, with no sign of any decline. Only very low interest rates are making it possible to service this debt without even more stringent fiscal ‘austerity’ (government spending cuts and tax rises). A large increase in government investment will drive debt up further, at least to begin with.
So governments are not doing what the Keynesians (outside and inside the IMF) want. Indeed, the IMF forecasts that budget balances will tighten not relax in both advanced and emerging markets next year. Morgan Stanley, the American investment bank, reckons that the governments of the advanced economies will ease fiscal policy next year but only by 0.3% of GDP — equating to a mild $115 billion increase in spending – nowhere near $1trn or $2trn. “Fiscal easing equivalent to 0.3% of GDP is unlikely to materially increase global growth,” said Elga Bartsch, lead author of the Morgan Stanley report.

The global debt hangover remains and the alka seltzer of cheap and plentiful credit has not cured it. The alternative of fiscal spending won’t work either and won’t be enough anyway. The mainstream economics of monetarism and Keynesianism cannot get rid of this hangover because the world capitalist economy is still drunk from too much debt and starved of profitability.
And now total corporate profits are falling globally while debt continues to rise – with the prospect of a new global slump on a fast-approaching horizon.
US economy – not so great
October 7, 2016
The US economy is the largest and most important capitalist economy. It is usually considered as having performed the best of the top seven largest economies since the end of the Great Recession in 2009. But is that really true?
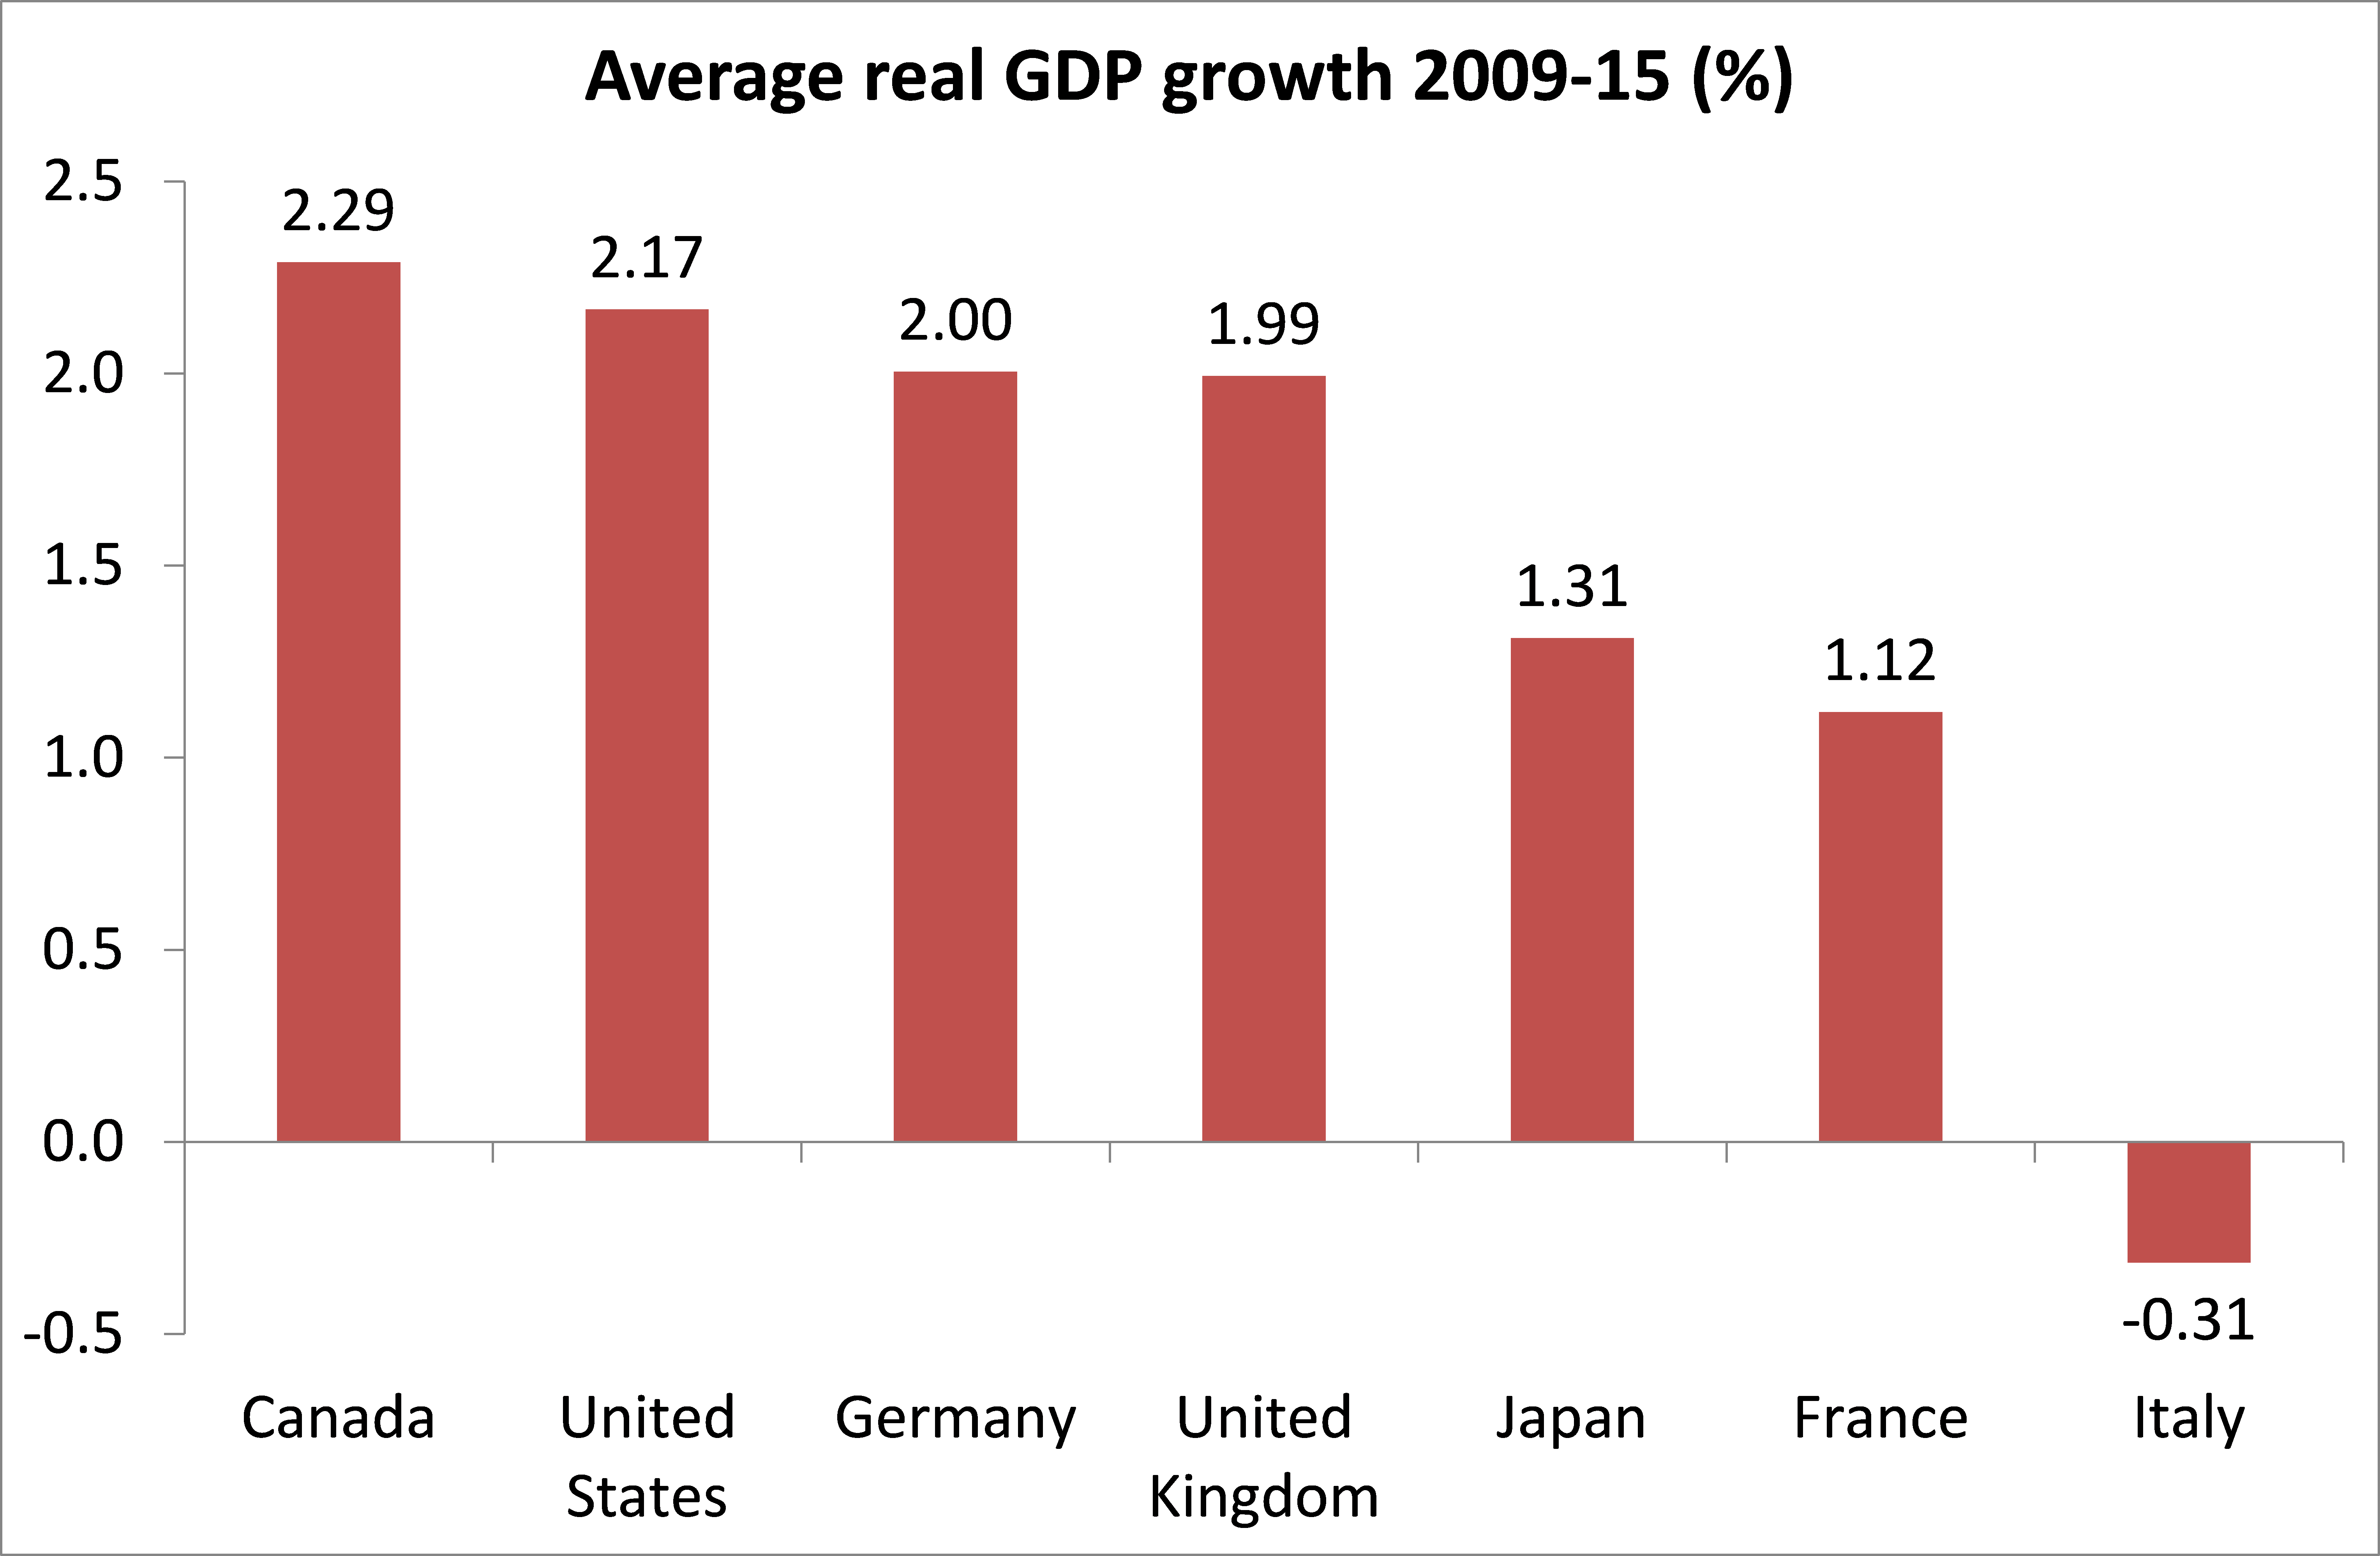
If we take the average real GDP growth since 2009, we find that US growth has been lower at just under 2.2% than Canada, admittedly a much smaller economy.

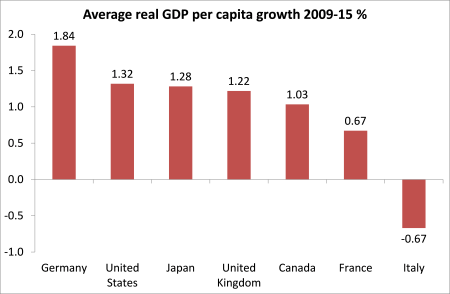
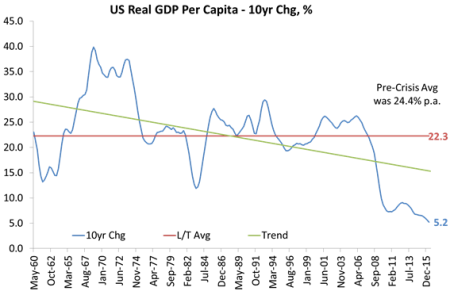
Similarly, if we look at the average real GDP growth per person (per capita), US economy has average growth of just 1.4% a year, much lower than Germany at over 1.9% a year – although all the G7 economies are performing poorly. In particular, note the terrible performance of Italy, with an average contraction in both GDP and GDP per capita.
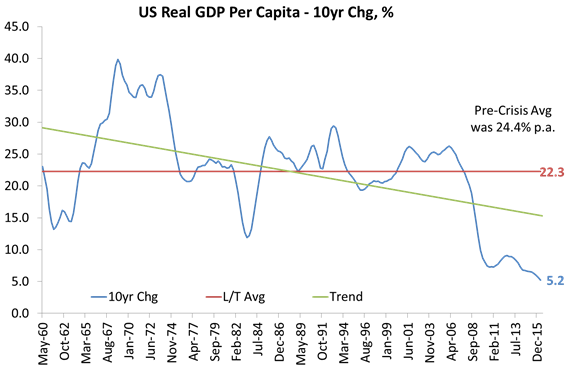
The story of the US economic giant since the Great Recession is one not just of stagnation but of disappearing economic growth in the weakest economic recovery after a slump since the 1930s.
In its latest economic outlook, the IMF is forecasting just 1.6% annual real GDP growth for the ‘advanced economies’ down from 2.1% in 2015 and down from its July forecast of 1.8%. And the main reason for this downgrade forecast is that the IMF now expects the US economy to expand at only 1.6% this year from a previous forecast of 2.2%. This slowdown is to be mirrored in the UK (forecast 1.8% from 2.2% in 2015) and in the Eurozone (1.7% from 2% in 2015). As for Japan, it is expected to expand in real terms by just 0.5%.
Maurice Obstfeld, the IMF’s chief economist, said the global economy held still significant risks fed by a “cocktail of interacting legacies” from the 2008 global financial crisis. These included high debt overhangs, bad loans on banks’ books and moribund investment, which were continuing to depress the global economy’s potential output. Growth “has been too low for too long, and in many countries its benefits have reached too few — with political repercussions that are likely to depress global growth further,” Mr Obstfeld said.
Yes, the end of globalisation and its benefits to the largest and most powerful capitalist economies is giving way to weak trade growth and the collapse of future international trade agreements as political leaders respond to pressure to drop trade pact like TPP or TTIP and in the case of the UK, to leave the European Union and seek bilateral trade deals.
The hope was that US economy would pick up in the second half of 2016 – yet another bout of optimism that is losing force. The Atlanta Fed Now GDP forecast is usually pretty accurate for US GDP growth. At the beginning of the quarter starting in July and finishing in September, it predicted a 3.7% annual growth rate. Now it is forecasting just 2.2%. Expect it to drop even lower before we get to the official figures. Similarly the Fed New York forecast is for 2.2% in the third quarter and just 1.2% in the fourth quarter.
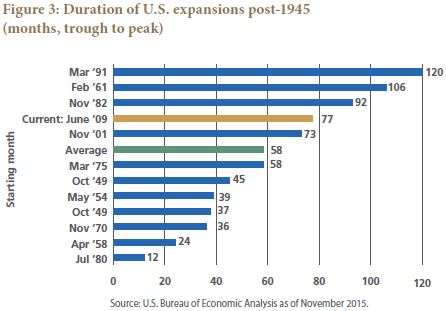
For the long term, the US Federal Reserve bank economists are now forecasting just 1.8% a year expansion for the US economy compared to 2.6% at the end of the Great Recession. And all this assumes no new economic recession. The current ‘recovery’ is already one of the longest since 1945, having been supported by massive monetary injections by central banks globally. But monetary pumping has not worked.
The likelihood of a new economic slump is high for 2017, as I have arguedin previous posts. But even without that, US capitalism’s economic performance is poor and only saved by the pitiful results achieved by other top capitalist economies.
If we take the average real GDP growth since 2009, we find that US growth has been lower at just under 2.2% than Canada, admittedly a much smaller economy.
Similarly, if we look at the average real GDP growth per person (per capita), US economy has average growth of just 1.4% a year, much lower than Germany at over 1.9% a year – although all the G7 economies are performing poorly. In particular, note the terrible performance of Italy, with an average contraction in both GDP and GDP per capita.

The story of the US economic giant since the Great Recession is one not just of stagnation but of disappearing economic growth in the weakest economic recovery after a slump since the 1930s.
In its latest economic outlook, the IMF is forecasting just 1.6% annual real GDP growth for the ‘advanced economies’ down from 2.1% in 2015 and down from its July forecast of 1.8%. And the main reason for this downgrade forecast is that the IMF now expects the US economy to expand at only 1.6% this year from a previous forecast of 2.2%. This slowdown is to be mirrored in the UK (forecast 1.8% from 2.2% in 2015) and in the Eurozone (1.7% from 2% in 2015). As for Japan, it is expected to expand in real terms by just 0.5%.
Maurice Obstfeld, the IMF’s chief economist, said the global economy held still significant risks fed by a “cocktail of interacting legacies” from the 2008 global financial crisis. These included high debt overhangs, bad loans on banks’ books and moribund investment, which were continuing to depress the global economy’s potential output. Growth “has been too low for too long, and in many countries its benefits have reached too few — with political repercussions that are likely to depress global growth further,” Mr Obstfeld said.
Yes, the end of globalisation and its benefits to the largest and most powerful capitalist economies is giving way to weak trade growth and the collapse of future international trade agreements as political leaders respond to pressure to drop trade pact like TPP or TTIP and in the case of the UK, to leave the European Union and seek bilateral trade deals.
The hope was that US economy would pick up in the second half of 2016 – yet another bout of optimism that is losing force. The Atlanta Fed Now GDP forecast is usually pretty accurate for US GDP growth. At the beginning of the quarter starting in July and finishing in September, it predicted a 3.7% annual growth rate. Now it is forecasting just 2.2%. Expect it to drop even lower before we get to the official figures. Similarly the Fed New York forecast is for 2.2% in the third quarter and just 1.2% in the fourth quarter.

For the long term, the US Federal Reserve bank economists are now forecasting just 1.8% a year expansion for the US economy compared to 2.6% at the end of the Great Recession. And all this assumes no new economic recession. The current ‘recovery’ is already one of the longest since 1945, having been supported by massive monetary injections by central banks globally. But monetary pumping has not worked.

The likelihood of a new economic slump is high for 2017, as I have arguedin previous posts. But even without that, US capitalism’s economic performance is poor and only saved by the pitiful results achieved by other top capitalist economies.
The US rate of profit 1948-2015
October 4, 2016
The US Department of Commerce’s Bureau of Economic Analysis (BEA) has just updated its estimates of net fixed capital stock in the US economy. This gives us the opportunity to measure the US rate of profit a la Marx up to 2015.
I made such measurements up to 2014 in a previous post about a year ago. Last December, I summed up the conclusions from the data. “First, the secular decline in the US rate of profit since 1945 is confirmed and indeed, on most measures, profitability is close to post-war lows. Second, the main cause of the secular fall is clearly a rise in the organic composition of capital, so Marx’s explanation of the law of the tendency of the rate of profit to fall is also confirmed. Third, profitability on most measures peaked in the late 1990s after the ‘neoliberal’ recovery. Since then, the US rate of profit has been static or falling. And fourth, since about 2010-12, profitability has started to fall again. Finally, the fall in the rate of profit in the US has now given way to a fall in the mass of profits.”
Now that we have all the 2015 data, I have revised the results with the help of Anders Axelsson from Sweden who has produced a very handy manual for anybody to use to work out and replicate the results. Anders has also checked the 2015 data as well. short-manual-for-downloading-rop-data-from-bureau-of-economic-analysis-1
The conclusions reached last year are pretty much unchanged. In last year’s post, I updated the rate of profit as measured using the assumptions and methods of Andrew Kliman in his book, The failure of capitalist production. AK measures the rate of profit for the corporate sector only and uses the historic cost of net fixed assets as the denominator. I also used a slightly different variation of AK’s approach in depreciating profits by current costs, while maintaining a historic cost measure of fixed assets. If all this sounds technical, it is and I refer you to the already cited papersand posts for an explanation. See Anders’ manual too. And there is special appendix in my new book, The Long Depression, on measuring the rate of profit.
Anyway, the results for the US corporate rate of profit look like this.
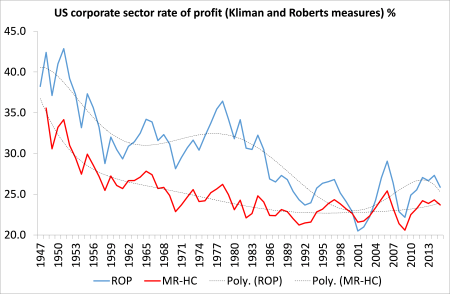
In AK’s measure the US corporate rate of profit falls from the late 1970s to a trough in 2001 and then it appears to make a recovery. But it could be said that the US rate of profit was more or less stable from the late 1980s. My slightly revised measure reveals a very steady decline until a stabilisation from the 1980s – or the traditional ‘neoliberal period’. Both measures suggest that the US corporate rate of profit has been at least static (with cyclical fluctuations) since 1997. Either way, the US corporate rate of profit is some 30% below where it was after WW2 and 20% below the 1960s.
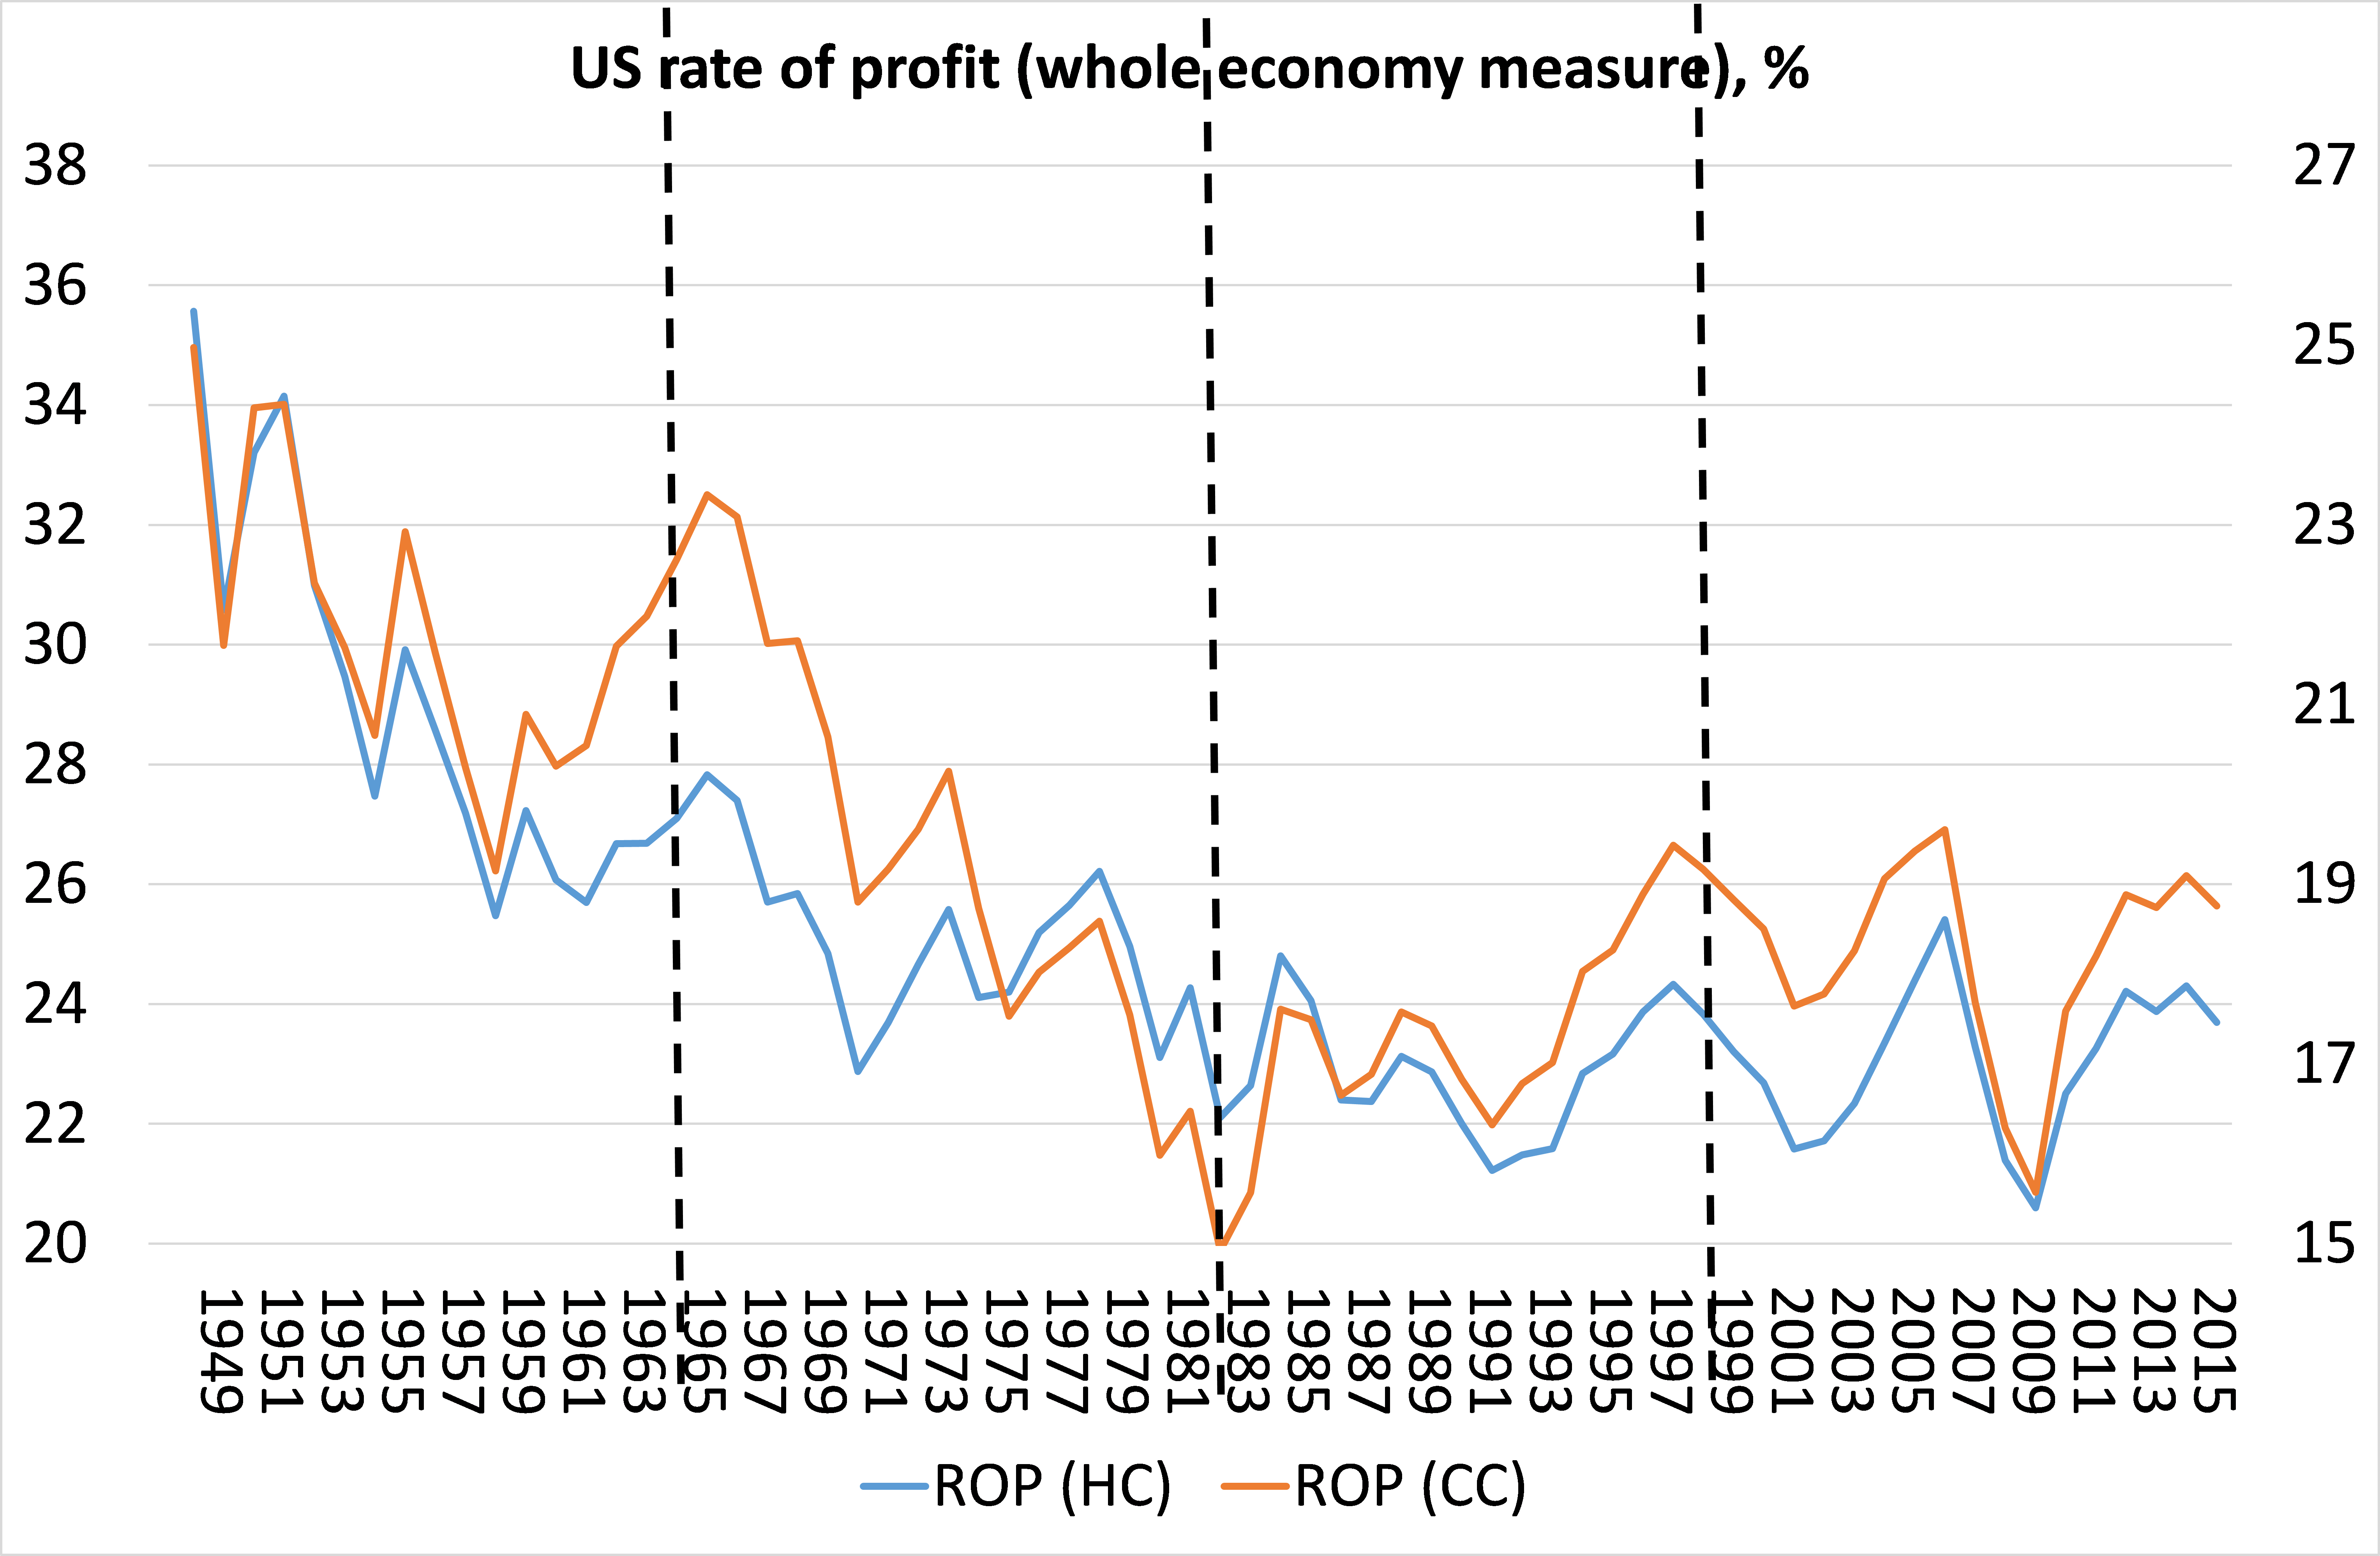
However, I prefer as a better guide to the health of a capitalist economy to look at the total surplus value created in an economy against the capital employed, thus following Marx’s basic formula, s/c+v. So I have a ‘whole economy’ measure using total national output, fixed assets and employee compensation for variable capital. The graph below shows the results updated to 2015 for this measure, using either historic or current costs to value fixed assets.

This shows that the overall US rate of profit has four phases: the post-war golden age of high profitability peaking in 1965; then the profitability crisis of the 1970s, troughing in the slump of 1980-2; then the neoliberal period of recovery or at least stabilisation in profitability, peaking more or less in 1997; then the current period of volatility and slight decline. The historic cost measure differs from the current cost measure in that the trough in profitability is actually at the end of the 1980s, as in Kliman’s measure. And the current cost measure always shows much greater upward or downward movement.
What is interesting about the update of data to 2015 is that it reveals that, whatever measure is used, the rate of profit in 2015 is lower than in 2012; lower than in 2006 (the peak of the last cycle); and lower than in 1997 when most measures peaked. So there is currently a downward phase in the rate of profit. Given the fall in the mass of profit during this year, we can expect to see a further decline in 2016. I’ll return to this point later when we look at the measures of profitability provided by the US Federal Reserve.
We can sum up the movements in the rate of profit as follows: (1 = base point)
So between 1948 and 2015, the US rate of profit declined between 25-33% depending on whether you measure fixed assets in historic (HC) and current costs (CC). Between 1965 and 1982, the rate fell 21-36%; but from 1982 to 1997 it rose 10-30%; but since 1997 it is down 3% and 4-7% from 2006.
And each economic recession in the US starting from the first large one in 1974-5 has been preceded by a fall in the rate of profit at least one year and often up to three years before. (1= base point)
Last year, I compared the change in the rate of profit to changes in the organic composition of capital (fixed assets divided by employee compensation) and the rate of surplus value (profits divided by employee compensation). I did this again for 2015 and it confirms Marx’s law of profitability, namely when the organic composition of capital rises faster than the rate of surplus value, the rate of profit will fall and vice versa.

Over the whole period, 1946-15, the rate of profit fell 30% (historic cost measure), while the organic composition of capital rose 46% and the rate of exploitation rose 2%.
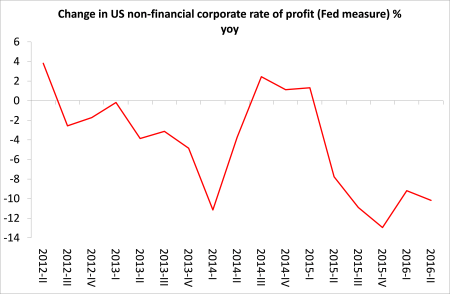
The US Federal Reserve also provides data from which we can glean an estimate of the US rate of profit and on an even more up to date basis (to mid-2016). However, the Fed measure only covers the non-financial corporate sector and only goes back to 1960. The Fed measure, a la Marx, is the net operating surplus (profit) over non-financial assets and employee compensation. It broadly confirms the long-term trends revealed in the whole economy measure.

More interestingly, the Fed measure shows that the rate of profit for non-financial companies has fallen since 2012 and particularly since 2014.
So, as I said at the start of this post, the main conclusions from last year remain. What the 2015 measures add is that the US rate of profit (on any measure) fell in 2015 and is now down about 3% from 2012. US corporate profits are falling in absolute terms and have been since early 2015.
The US rate of profit is likely to have fallen again this year and that fall is accelerating according to the more high frequency Fed data.
I made such measurements up to 2014 in a previous post about a year ago. Last December, I summed up the conclusions from the data. “First, the secular decline in the US rate of profit since 1945 is confirmed and indeed, on most measures, profitability is close to post-war lows. Second, the main cause of the secular fall is clearly a rise in the organic composition of capital, so Marx’s explanation of the law of the tendency of the rate of profit to fall is also confirmed. Third, profitability on most measures peaked in the late 1990s after the ‘neoliberal’ recovery. Since then, the US rate of profit has been static or falling. And fourth, since about 2010-12, profitability has started to fall again. Finally, the fall in the rate of profit in the US has now given way to a fall in the mass of profits.”
Now that we have all the 2015 data, I have revised the results with the help of Anders Axelsson from Sweden who has produced a very handy manual for anybody to use to work out and replicate the results. Anders has also checked the 2015 data as well. short-manual-for-downloading-rop-data-from-bureau-of-economic-analysis-1
The conclusions reached last year are pretty much unchanged. In last year’s post, I updated the rate of profit as measured using the assumptions and methods of Andrew Kliman in his book, The failure of capitalist production. AK measures the rate of profit for the corporate sector only and uses the historic cost of net fixed assets as the denominator. I also used a slightly different variation of AK’s approach in depreciating profits by current costs, while maintaining a historic cost measure of fixed assets. If all this sounds technical, it is and I refer you to the already cited papersand posts for an explanation. See Anders’ manual too. And there is special appendix in my new book, The Long Depression, on measuring the rate of profit.
Anyway, the results for the US corporate rate of profit look like this.

In AK’s measure the US corporate rate of profit falls from the late 1970s to a trough in 2001 and then it appears to make a recovery. But it could be said that the US rate of profit was more or less stable from the late 1980s. My slightly revised measure reveals a very steady decline until a stabilisation from the 1980s – or the traditional ‘neoliberal period’. Both measures suggest that the US corporate rate of profit has been at least static (with cyclical fluctuations) since 1997. Either way, the US corporate rate of profit is some 30% below where it was after WW2 and 20% below the 1960s.
However, I prefer as a better guide to the health of a capitalist economy to look at the total surplus value created in an economy against the capital employed, thus following Marx’s basic formula, s/c+v. So I have a ‘whole economy’ measure using total national output, fixed assets and employee compensation for variable capital. The graph below shows the results updated to 2015 for this measure, using either historic or current costs to value fixed assets.
This shows that the overall US rate of profit has four phases: the post-war golden age of high profitability peaking in 1965; then the profitability crisis of the 1970s, troughing in the slump of 1980-2; then the neoliberal period of recovery or at least stabilisation in profitability, peaking more or less in 1997; then the current period of volatility and slight decline. The historic cost measure differs from the current cost measure in that the trough in profitability is actually at the end of the 1980s, as in Kliman’s measure. And the current cost measure always shows much greater upward or downward movement.
What is interesting about the update of data to 2015 is that it reveals that, whatever measure is used, the rate of profit in 2015 is lower than in 2012; lower than in 2006 (the peak of the last cycle); and lower than in 1997 when most measures peaked. So there is currently a downward phase in the rate of profit. Given the fall in the mass of profit during this year, we can expect to see a further decline in 2016. I’ll return to this point later when we look at the measures of profitability provided by the US Federal Reserve.
We can sum up the movements in the rate of profit as follows: (1 = base point)
| 1948-65 | 1965-82 | 1982-97 | 1997-15 | 1948-15 | 2006-15 | |
| HC | 0.78 | 0.79 | 1.10 | 0.97 | 0.67 | 0.93 |
| CC | 0.93 | 0.64 | 1.30 | 0.97 | 0.75 | 0.96 |
And each economic recession in the US starting from the first large one in 1974-5 has been preceded by a fall in the rate of profit at least one year and often up to three years before. (1= base point)
| 1973-5 | 1978-82 | 1988-91 | 1997-01 | 2006-9 | |
| HC | 0.95 | 0.84 | 0.92 | 0.89 | 0.81 |
| CC | 0.87 | 0.80 | 0.93 | 0.91 | 0.79 |
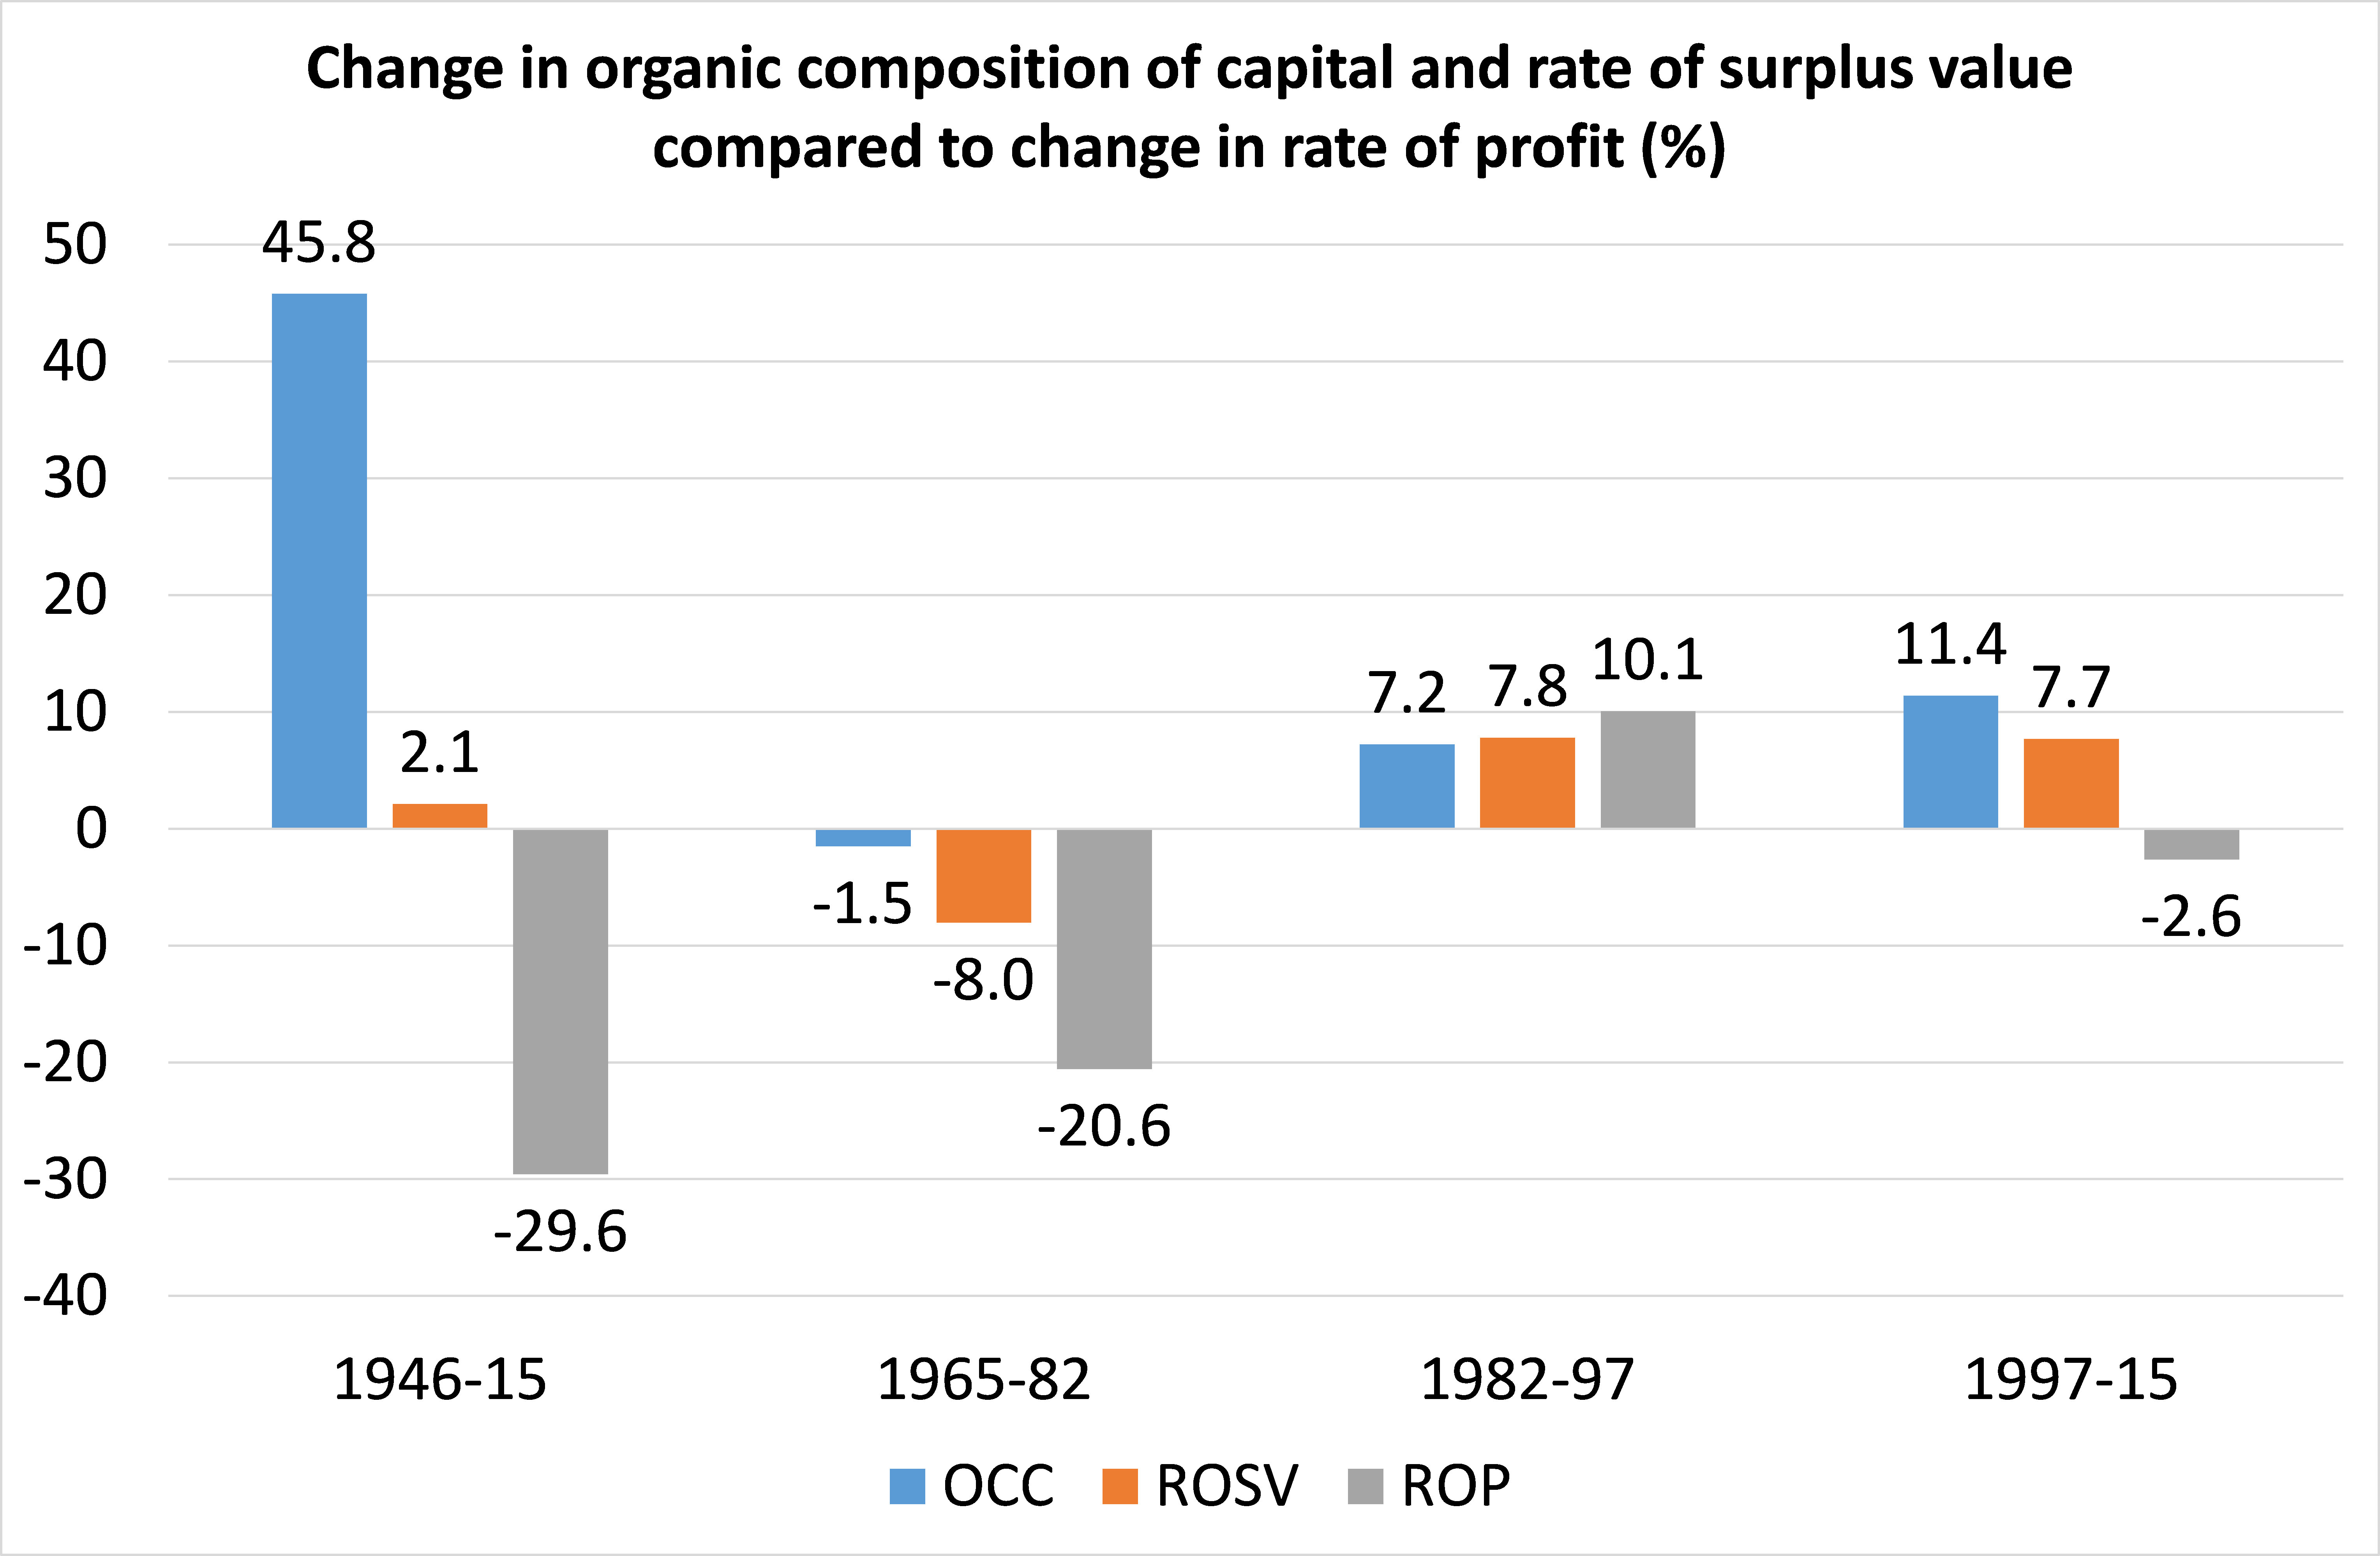
Over the whole period, 1946-15, the rate of profit fell 30% (historic cost measure), while the organic composition of capital rose 46% and the rate of exploitation rose 2%.
The US Federal Reserve also provides data from which we can glean an estimate of the US rate of profit and on an even more up to date basis (to mid-2016). However, the Fed measure only covers the non-financial corporate sector and only goes back to 1960. The Fed measure, a la Marx, is the net operating surplus (profit) over non-financial assets and employee compensation. It broadly confirms the long-term trends revealed in the whole economy measure.

More interestingly, the Fed measure shows that the rate of profit for non-financial companies has fallen since 2012 and particularly since 2014.
So, as I said at the start of this post, the main conclusions from last year remain. What the 2015 measures add is that the US rate of profit (on any measure) fell in 2015 and is now down about 3% from 2012. US corporate profits are falling in absolute terms and have been since early 2015.
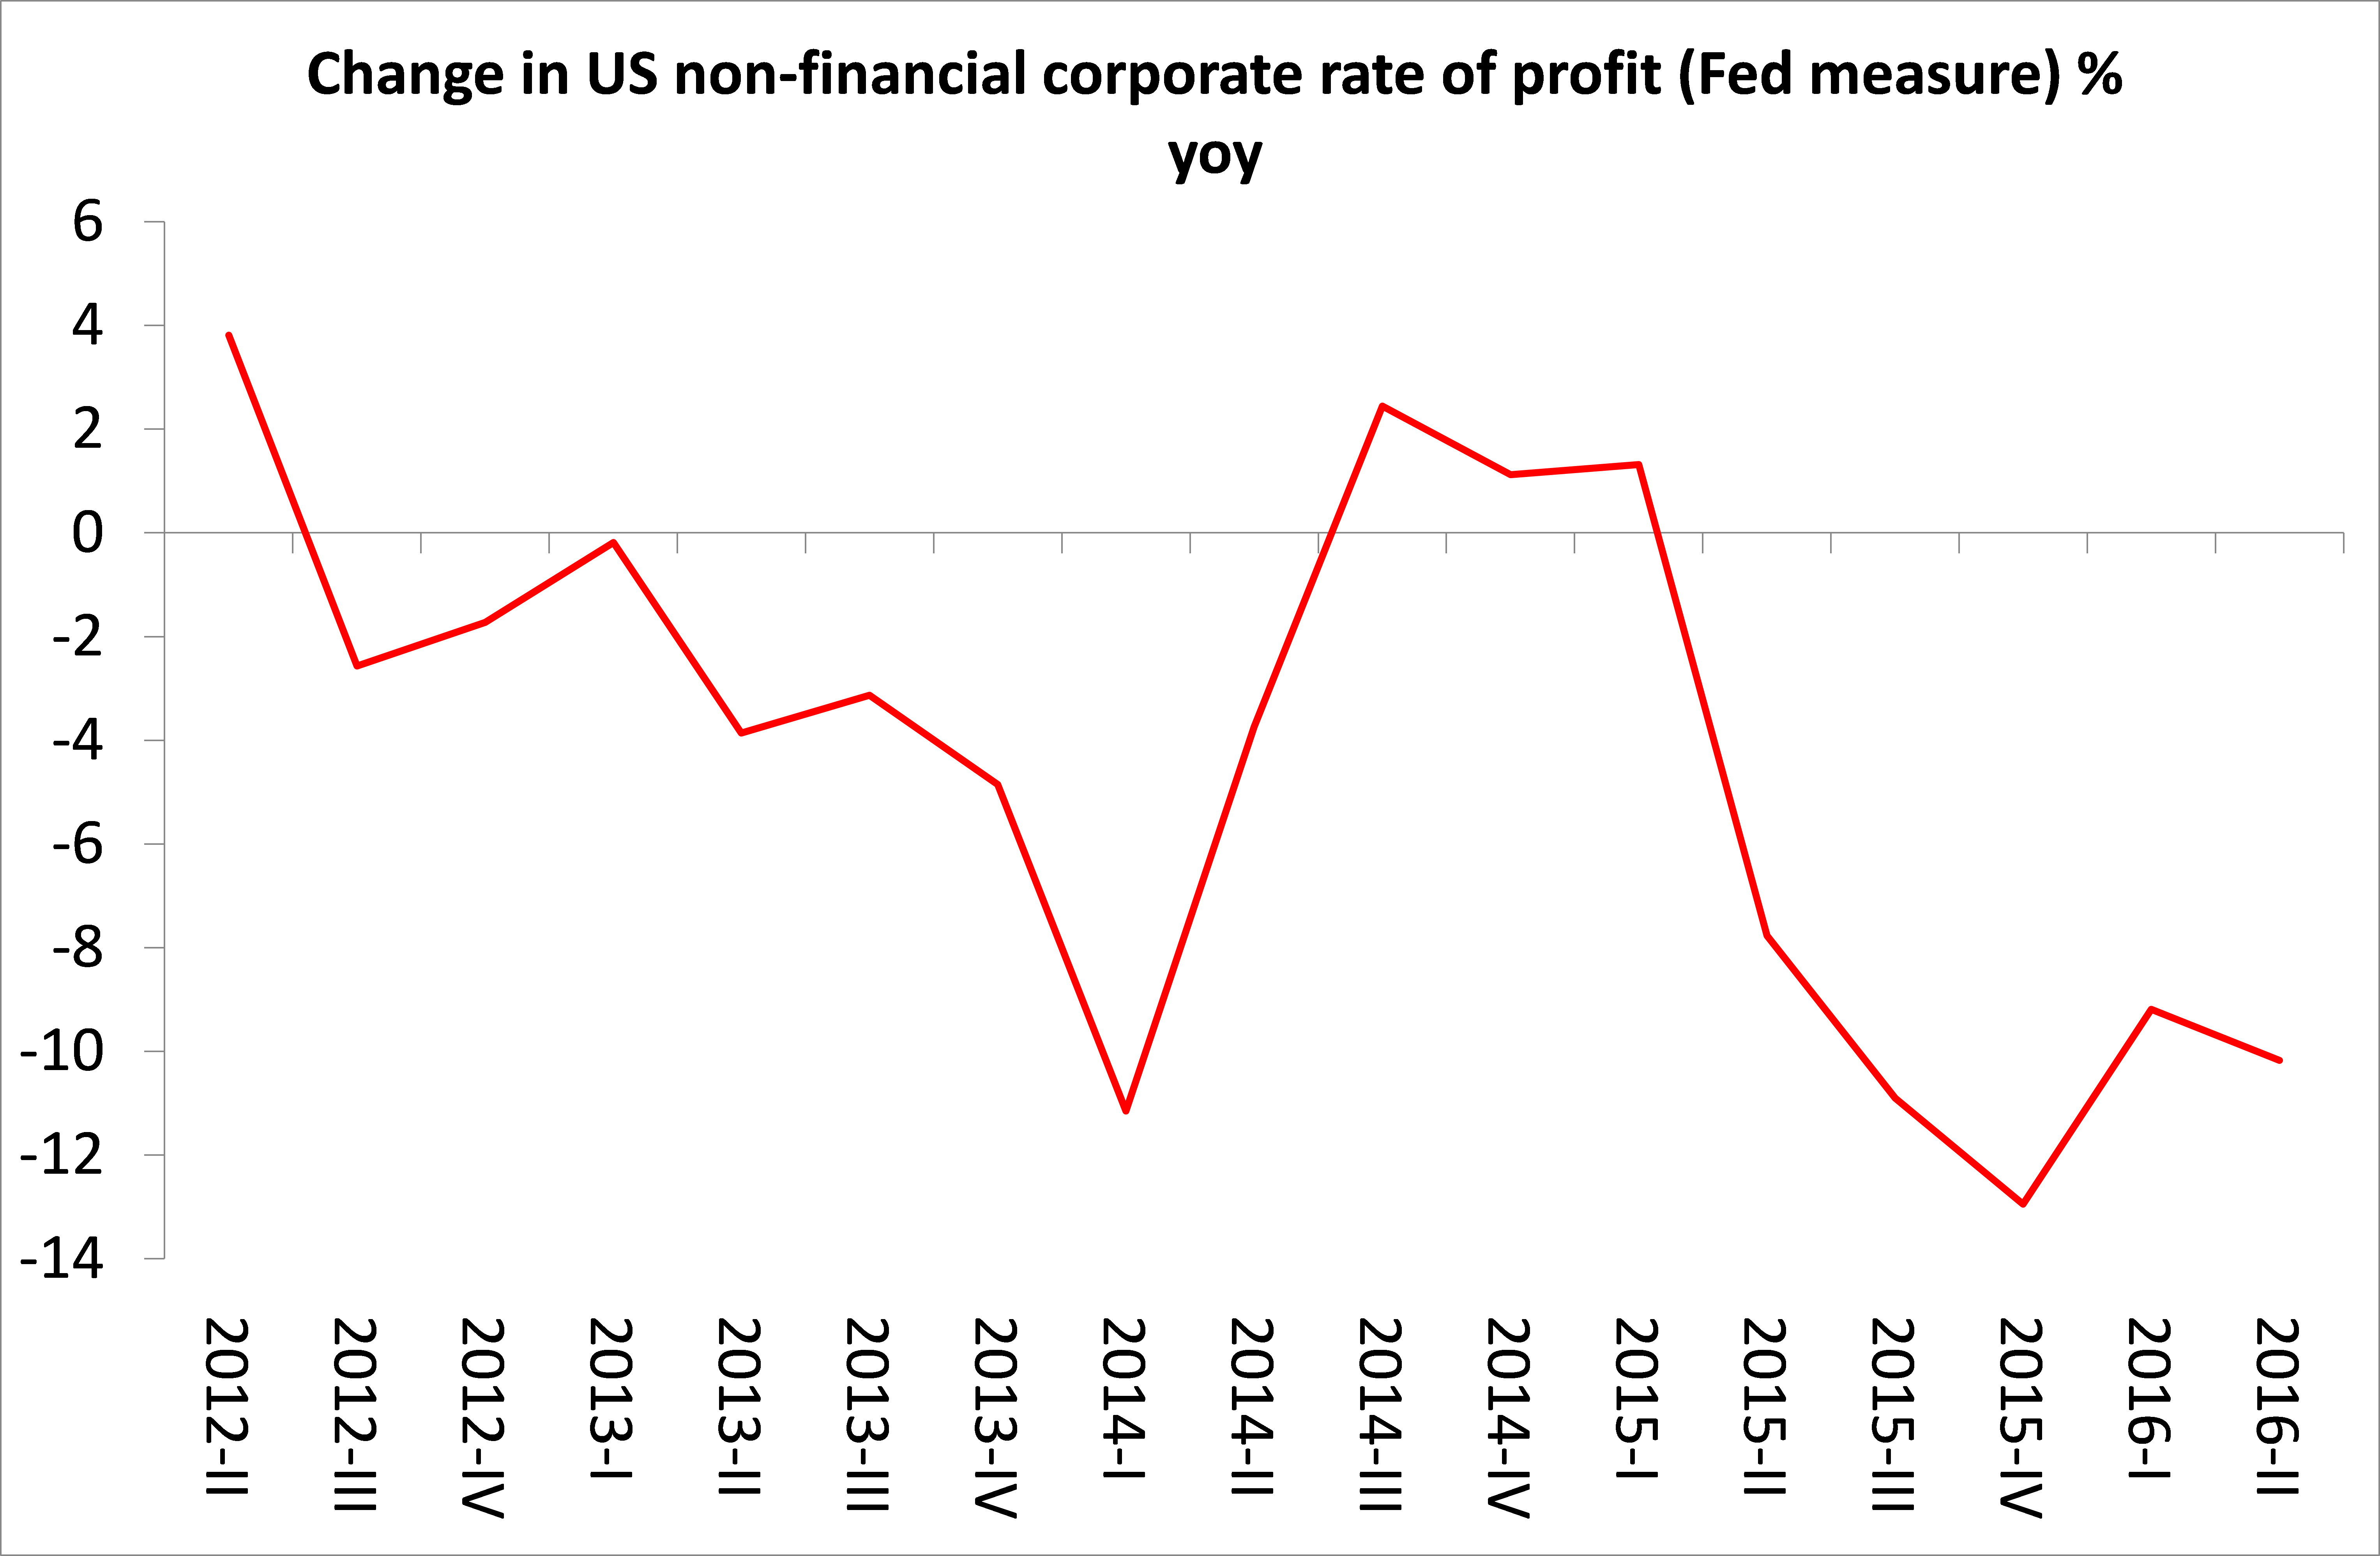
The US rate of profit is likely to have fallen again this year and that fall is accelerating according to the more high frequency Fed data.
Global turbulence ahead
September 29, 2016
This coming week sees the start of the semi-annual meeting of the IMF and World Bank in New York. This is an opportunity for the world’s economic strategists to review the state of the major world economies. And it’s not good news. Earlier this month, the OECD, which looks after the world’s top 30 economies, reported in its ‘interim economic forecast’ that global GDP growth (including India and China) would be flat around 3% in 2016 with only a modest improvement projected in 2017. Overall, the OECD reckoned that the world economy “remained in a low-growth trap with persistent growth disappointments weighing on growth expectations and feeding back into weak trade, investment, productivity and wages.”Catherine Mann, chief economist at the OECD, said: “Action was needed to lift the global economy out of a low-growth trap”, she said. “The spiral is not upwards, it is downwards. Downwards on trade, downwards on productivity, downwards on global growth.”
As for world trade, prior to this weekend’s IMF meeting, its economists published a chapter from its upcoming World Economic Outlook in which they argued that one of the features of the current slow growth (depression) was the unprecedented decline in world trade growth. “Since 2012, growth in the volume of world trade in goods and services has been less than half the rate during the preceding three decades. It has barely kept pace with world GDP and the slowdown has been widespread. The IMF economists calculate that this slow trade is mostly a symptom of the sluggish economic recovery. “Indeed, up to three-fourths of the shortfall in real trade growth since 2012 compared with 2003–07 can be traced to globally weaker economic growth, notably subdued investment.”
UNCTAD, the division of the UN economics that looks at so-called developing economies, issued a report which concluded that the world is on the verge of “entering a third phase of the financial crisis”. Alarm bells have been ringing over the explosion of corporate debt levels in emerging economies, which now exceed $25 trillion. “Damaging deflationary spirals cannot be ruled out.” According to UNCTAD, many ‘developing’ countries are doing no such thing (i.e. developing). There is no investment in the productive sectors to be found. Many countries have fallen further behind the rich world than they were in 1980, despite ‘opening up’ their economies to multinational capital flows. While the profit share of GDP in emerging economy has risen to an historic high of 36% of GDP from 30% in 1980, private investment has slumped to 17% from 21%. In other words, much of the profit made has left the country or been invested in unproductive sectors like real estate or financial speculation.
Also, as global interest rates have fallen, corporate debt in emerging markets has risen from 57% to 104% of GDP since the end of 2008, posing a real risk of financial collapse if a new global recession should appear or if interest rates jump sharply and national currencies plunge against the dollar or euro.
Weak investment is the cry of all these international agencies. And it has also been the message of private sector economic strategists like McKinsey, the management consultants. In a new report, calledTurbulence ahead: Renewing consensus amidst greater volatility, McKinsey outlines why global trade and growth has slowed to a crawl since the end of the Great Recession in 2009. “The shock of the 2008 global financial crisis triggered the first recorded drop in global GDP and the hangover has since persisted, with many countries struggling with unexpectedly weak recoveries.” And it is not going to get any better, McKinsey projects:“More worryingly, long-term growth prospects are serious cause for concern. Annual GDP growth from 2014 to 2064 is projected to effectively halve, falling to 2.1 percent globally and 1.9 percent for developed countries”.
Existing policies adopted by governments have not worked: “private and public investment remain unresponsive to this cheap credit. Even the much anticipated policy of quantitative easing has done little to change this.” Investment growth has slowed significantly since 2008. It collapsed outright in the European Union (EU), declining by $330 billion. Although gross investment in the US has picked up, net investment as a percentage of GDP has halved since 2007. Companies have invested in more short-lived assets but failed to compensate by raising gross investment. Without the state-directed investment by China, the global figures would be even worse. “China has propped up global investment, constituting 79 percent of the rise in investment since 2008. But this will not last: annual investment growth in China is expected to fall from 10.4 percent between 2008 and 2015 to 4.5 percent between 2015 and 2030.”
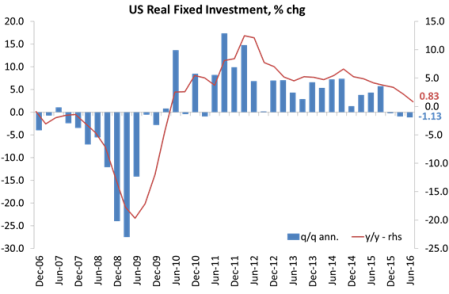
Indeed, the very latest data from the US – up to mid-2016 – show that US fixed investment has ground to a halt.
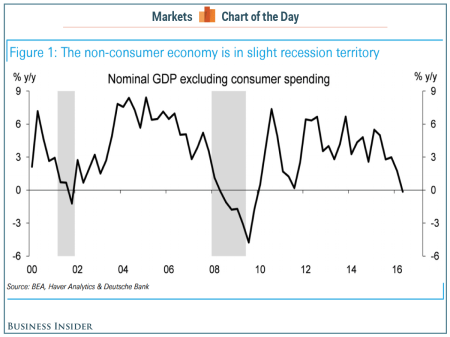
I have discussed the cause of this poor investment record in several posts. In my view, it is not due to “poor consumer demand” stopping companies from stepping up investment. Growth in consumer spending has been relatively robust since 2009. Indeed, when consumer spending is excluded, the rest of the US economy is already in negative territory.
Nor is poor or even negative investment due to ‘uncertainty’ or regulation etc. It just comes down to profitability. I have cited an increasing number of studies that confirm this. For example, mainstream economists Kothari, Lewellen and Warner wrote a paper called The behavior of corporate investment.AggregateInvestment
The authors find a close causal correlation between the movement in US business investment and business profitability. The three mainstream authors of the paper find that “investment growth is highly predictable, up to 1½ years in advance, using past profits and stock returns but has little connection to interest rates, credit spreads, or stock volatility. Indeed, profits and stock returns swamp the predictive power of other variables proposed in the literature.” And that “Profits show a clear business-cycle pattern and a clear correlation with investment.”
The data show that investment grows rapidly following high profits and stock returns—consistent with virtually any model of corporate investment—but can take up to a year and a half to fully adjust. This was exactly the conclusion that I reached in my own study and jointly with G Carchedi (http://gesd.free.fr/robcarch13.pdf).
And in a recent report, JP Morgan economists point out that capital-to-output ratios are above their historical average and capital productivity has trended lower over the past decade. In Marxist terms, the organic composition of capital is rising and the returns on capital stock are declining. The latest official figures for capital stock up to 2015 in the US are now available, so in a future post, I shall update the latest position on the US rate of profit, a la Marx.
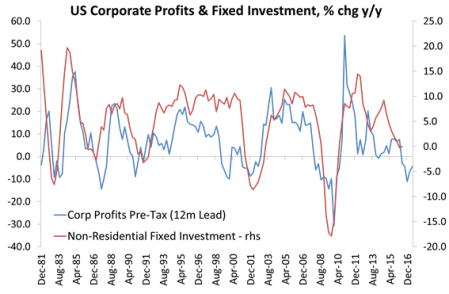
But in the meantime, let me repeat the work of the senior economist at the Cleveland Federal Reserve, who found that “A simple correlation analysis shows that the correlation between the change in corporate profits and the contemporaneous change in industrial production is 54 percent, but the correlation goes up to 66 percent if I use the one-quarter-ahead change in industrial production. Similarly, the correlation between the change in corporate profits and the contemporaneous change in gross domestic private investment is 57 percent, but the correlation goes up to 68 percent if I use the one-quarter-ahead change in investment. More formally, a Granger causality test indicates that the quarterly change in profits leads the quarterly change in production by one quarter, but the change in profits is independent of the change in production. A similar relationship applies to the quarterly change in profits and investment.6Thus, firms seem to adjust their production and investment after seeing a drop in their profits.”
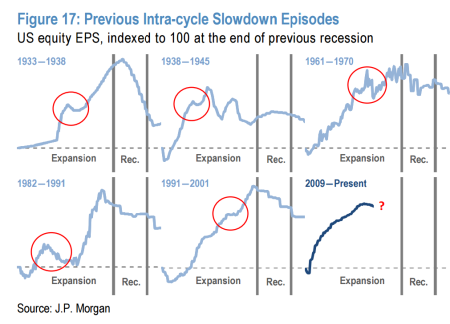
According to Dubravko Lakos-Bujas at JP Morgan, since 1900 there have been 27 instances of two straight quarters of corporate earnings decline, similar to what we have now. Lakos-Bujas goes on: “Declining corporate profits as measured by US equity EPS have been closely followed by, or coincided with, a recession 81% of the time since 1900.”
The economists at Deutsche Bank have also reached similar conclusions. They cite four indicators that popped up before the recessions in 1990, 2001, and 2008. And they are showing red now. First, there’s already arecession for US profits. They’ve been sliding since they peaked in the second quarter of 2014. Second, the Fed’s Labor Market Conditions Index, a tracker of multiple indicators, turned negative in August. A subzero reading was followed by a recession five times in the last 40 years. Third, capital-expenditure growth has turned negative, down 2% over the past year. And fourth, corporate default rates are rising.
There was only one year (1986) in the last 60 years when US corporate margins declined without this leading to a recession. It was also the only period in 40 years when a recession did not happen even though capital-expenditure growth declined. So usually, where profits go, investment follows. And the very latest US figures show just that.
As the IMF and the World Bank meetings take place, the global economy remains in a weak state. The IMF economists are calling for global coordinated action to “counteract renewed slowdowns” In a new paper, they claim that the right policies can “debunk widespread concerns that little can be done by policymakers facing a vicious cycle of (too) low growth, (too) low inflation, near-zero interest rates, and high debt levels.”They call for fiscal action (government spending and investment); and ‘structural reforms’ of labour markets and stronger banks and financial systems.
Apart from the question of whether any of these policies would work, there is no sign that the governments of the major economies are prepared to coordinate globally any policy action. Government investment to compensate for weak business investment is still being cut in most countries to try and ‘balance the budget’ and keep government debt down. Structural reforms (namely privatisation and reduction in labour rights) are facing serious opposition from labour. And there are now new signs that banks are back in trouble (Deutsche Bank in Germany; Italian banks etc).
Real GDP per capita growth is slowing in both the advanced capitalist economies and the so-called emerging ones, while the big beast in global expansion, China is also slowing. Now if the US economy should falter from its already snail-like pace, all bets are off for avoiding a new global slump. The indicators are starting to turn red. So, as McKinsey puts it, global turbulence lies ahead.
As for world trade, prior to this weekend’s IMF meeting, its economists published a chapter from its upcoming World Economic Outlook in which they argued that one of the features of the current slow growth (depression) was the unprecedented decline in world trade growth. “Since 2012, growth in the volume of world trade in goods and services has been less than half the rate during the preceding three decades. It has barely kept pace with world GDP and the slowdown has been widespread. The IMF economists calculate that this slow trade is mostly a symptom of the sluggish economic recovery. “Indeed, up to three-fourths of the shortfall in real trade growth since 2012 compared with 2003–07 can be traced to globally weaker economic growth, notably subdued investment.”
UNCTAD, the division of the UN economics that looks at so-called developing economies, issued a report which concluded that the world is on the verge of “entering a third phase of the financial crisis”. Alarm bells have been ringing over the explosion of corporate debt levels in emerging economies, which now exceed $25 trillion. “Damaging deflationary spirals cannot be ruled out.” According to UNCTAD, many ‘developing’ countries are doing no such thing (i.e. developing). There is no investment in the productive sectors to be found. Many countries have fallen further behind the rich world than they were in 1980, despite ‘opening up’ their economies to multinational capital flows. While the profit share of GDP in emerging economy has risen to an historic high of 36% of GDP from 30% in 1980, private investment has slumped to 17% from 21%. In other words, much of the profit made has left the country or been invested in unproductive sectors like real estate or financial speculation.
Also, as global interest rates have fallen, corporate debt in emerging markets has risen from 57% to 104% of GDP since the end of 2008, posing a real risk of financial collapse if a new global recession should appear or if interest rates jump sharply and national currencies plunge against the dollar or euro.
Weak investment is the cry of all these international agencies. And it has also been the message of private sector economic strategists like McKinsey, the management consultants. In a new report, calledTurbulence ahead: Renewing consensus amidst greater volatility, McKinsey outlines why global trade and growth has slowed to a crawl since the end of the Great Recession in 2009. “The shock of the 2008 global financial crisis triggered the first recorded drop in global GDP and the hangover has since persisted, with many countries struggling with unexpectedly weak recoveries.” And it is not going to get any better, McKinsey projects:“More worryingly, long-term growth prospects are serious cause for concern. Annual GDP growth from 2014 to 2064 is projected to effectively halve, falling to 2.1 percent globally and 1.9 percent for developed countries”.
Existing policies adopted by governments have not worked: “private and public investment remain unresponsive to this cheap credit. Even the much anticipated policy of quantitative easing has done little to change this.” Investment growth has slowed significantly since 2008. It collapsed outright in the European Union (EU), declining by $330 billion. Although gross investment in the US has picked up, net investment as a percentage of GDP has halved since 2007. Companies have invested in more short-lived assets but failed to compensate by raising gross investment. Without the state-directed investment by China, the global figures would be even worse. “China has propped up global investment, constituting 79 percent of the rise in investment since 2008. But this will not last: annual investment growth in China is expected to fall from 10.4 percent between 2008 and 2015 to 4.5 percent between 2015 and 2030.”
Indeed, the very latest data from the US – up to mid-2016 – show that US fixed investment has ground to a halt.

I have discussed the cause of this poor investment record in several posts. In my view, it is not due to “poor consumer demand” stopping companies from stepping up investment. Growth in consumer spending has been relatively robust since 2009. Indeed, when consumer spending is excluded, the rest of the US economy is already in negative territory.
Nor is poor or even negative investment due to ‘uncertainty’ or regulation etc. It just comes down to profitability. I have cited an increasing number of studies that confirm this. For example, mainstream economists Kothari, Lewellen and Warner wrote a paper called The behavior of corporate investment.AggregateInvestment
The authors find a close causal correlation between the movement in US business investment and business profitability. The three mainstream authors of the paper find that “investment growth is highly predictable, up to 1½ years in advance, using past profits and stock returns but has little connection to interest rates, credit spreads, or stock volatility. Indeed, profits and stock returns swamp the predictive power of other variables proposed in the literature.” And that “Profits show a clear business-cycle pattern and a clear correlation with investment.”
The data show that investment grows rapidly following high profits and stock returns—consistent with virtually any model of corporate investment—but can take up to a year and a half to fully adjust. This was exactly the conclusion that I reached in my own study and jointly with G Carchedi (http://gesd.free.fr/robcarch13.pdf).
And in a recent report, JP Morgan economists point out that capital-to-output ratios are above their historical average and capital productivity has trended lower over the past decade. In Marxist terms, the organic composition of capital is rising and the returns on capital stock are declining. The latest official figures for capital stock up to 2015 in the US are now available, so in a future post, I shall update the latest position on the US rate of profit, a la Marx.
But in the meantime, let me repeat the work of the senior economist at the Cleveland Federal Reserve, who found that “A simple correlation analysis shows that the correlation between the change in corporate profits and the contemporaneous change in industrial production is 54 percent, but the correlation goes up to 66 percent if I use the one-quarter-ahead change in industrial production. Similarly, the correlation between the change in corporate profits and the contemporaneous change in gross domestic private investment is 57 percent, but the correlation goes up to 68 percent if I use the one-quarter-ahead change in investment. More formally, a Granger causality test indicates that the quarterly change in profits leads the quarterly change in production by one quarter, but the change in profits is independent of the change in production. A similar relationship applies to the quarterly change in profits and investment.6Thus, firms seem to adjust their production and investment after seeing a drop in their profits.”
According to Dubravko Lakos-Bujas at JP Morgan, since 1900 there have been 27 instances of two straight quarters of corporate earnings decline, similar to what we have now. Lakos-Bujas goes on: “Declining corporate profits as measured by US equity EPS have been closely followed by, or coincided with, a recession 81% of the time since 1900.”
The economists at Deutsche Bank have also reached similar conclusions. They cite four indicators that popped up before the recessions in 1990, 2001, and 2008. And they are showing red now. First, there’s already arecession for US profits. They’ve been sliding since they peaked in the second quarter of 2014. Second, the Fed’s Labor Market Conditions Index, a tracker of multiple indicators, turned negative in August. A subzero reading was followed by a recession five times in the last 40 years. Third, capital-expenditure growth has turned negative, down 2% over the past year. And fourth, corporate default rates are rising.
There was only one year (1986) in the last 60 years when US corporate margins declined without this leading to a recession. It was also the only period in 40 years when a recession did not happen even though capital-expenditure growth declined. So usually, where profits go, investment follows. And the very latest US figures show just that.

As the IMF and the World Bank meetings take place, the global economy remains in a weak state. The IMF economists are calling for global coordinated action to “counteract renewed slowdowns” In a new paper, they claim that the right policies can “debunk widespread concerns that little can be done by policymakers facing a vicious cycle of (too) low growth, (too) low inflation, near-zero interest rates, and high debt levels.”They call for fiscal action (government spending and investment); and ‘structural reforms’ of labour markets and stronger banks and financial systems.
Apart from the question of whether any of these policies would work, there is no sign that the governments of the major economies are prepared to coordinate globally any policy action. Government investment to compensate for weak business investment is still being cut in most countries to try and ‘balance the budget’ and keep government debt down. Structural reforms (namely privatisation and reduction in labour rights) are facing serious opposition from labour. And there are now new signs that banks are back in trouble (Deutsche Bank in Germany; Italian banks etc).
Real GDP per capita growth is slowing in both the advanced capitalist economies and the so-called emerging ones, while the big beast in global expansion, China is also slowing. Now if the US economy should falter from its already snail-like pace, all bets are off for avoiding a new global slump. The indicators are starting to turn red. So, as McKinsey puts it, global turbulence lies ahead.
No hay comentarios:
Publicar un comentario